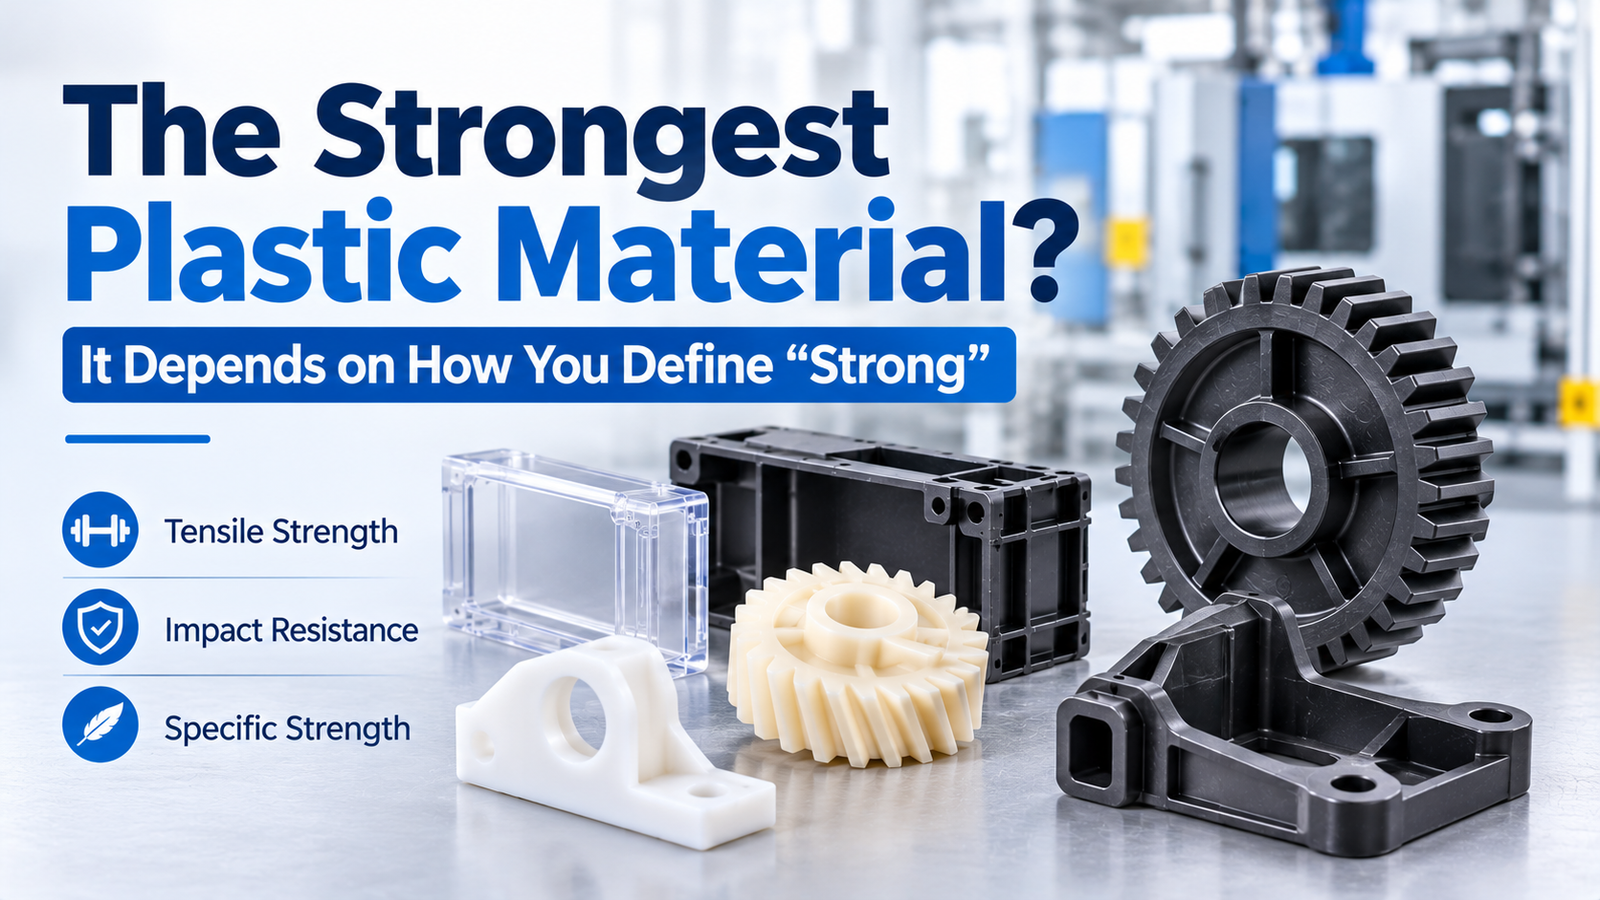
The strongest plastic material depends on three different definitions, depending on who is asking: the highest tensile strength, the highest impact resistance, or the highest strength per kilogram. The answers are different materials, and choosing the wrong definition is how parts end up over-specified, over-budget, or failing in a way nobody predicted.
This guide ranks the engineering plastics by tensile strength, explains what glass and carbon fiber actually do, and shows where the strongest material is the wrong answer.
Three definitions of strong
| What "strong" means | Property | Test | Winner |
|---|---|---|---|
| Won't break when pulled | Tensile strength | ISO 527 / ASTM D638 | Carbon-filled PEEK |
| Won't break when hit | Notched impact | ISO 179 / ASTM D256 | PC, PA, UHMW-PE |
| Strong for its weight | Specific strength | Strength ÷ density | Carbon-filled grades |
| Won't deform over time | Creep resistance | ISO 899 | PPS, PEEK, PAI |
A material can be first on one list and last on another. PC has the highest impact resistance in this guide and one of the lowest tensile strengths; PEEK-CF30 has the highest tensile strength and mediocre impact. The specification question is always "which failure mode are we preventing?" — not "which plastic is strongest?"
Strongest plastic material: tensile strength ranking
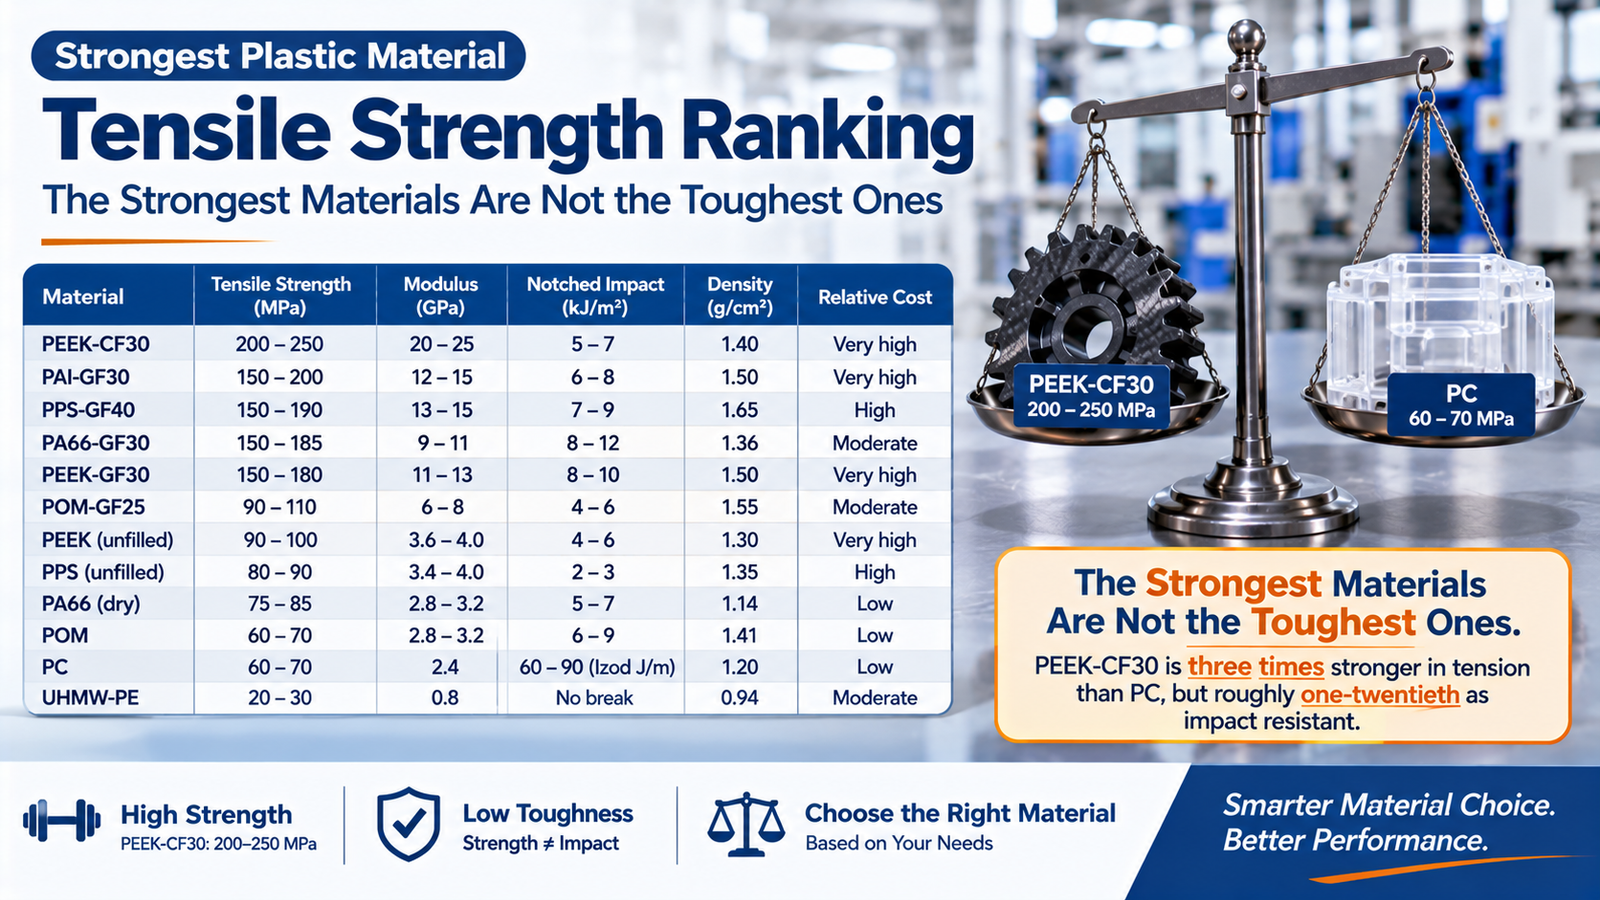
| Material | Tensile strength (MPa) | Modulus (GPa) | Notched impact (kJ/m²) | Density (g/cm³) | Relative cost |
|---|---|---|---|---|---|
| PEEK-CF30 | 200 – 250 | 20 – 25 | 5 – 7 | 1.40 | Very high |
| PAI-GF30 | 150 – 200 | 12 – 15 | 6 – 8 | 1.50 | Very high |
| PPS-GF40 | 150 – 190 | 13 – 15 | 7 – 9 | 1.65 | High |
| PA66-GF30 | 150 – 185 | 9 – 11 | 8 – 12 | 1.36 | Moderate |
| PEEK-GF30 | 150 – 180 | 11 – 13 | 8 – 10 | 1.50 | Very high |
| POM-GF25 | 90 – 110 | 6 – 8 | 4 – 6 | 1.55 | Moderate |
| PEEK (unfilled) | 90 – 100 | 3.6 – 4.0 | 4 – 6 | 1.30 | Very high |
| PPS (unfilled) | 80 – 90 | 3.4 – 4.0 | 2 – 3 | 1.35 | High |
| PA66 (dry) | 75 – 85 | 2.8 – 3.2 | 5 – 7 | 1.14 | Low |
| POM | 60 – 70 | 2.8 – 3.2 | 6 – 9 | 1.41 | Low |
| PC | 60 – 70 | 2.4 | 60 – 90 (Izod J/m) | 1.20 | Low |
| UHMW-PE | 20 – 30 | 0.8 | No break | 0.94 | Moderate |
Read the impact column against the strength column and the pattern is obvious: the strongest materials are not the toughest ones. PEEK-CF30 is three times stronger in tension than PC and roughly one-twentieth as impact resistant.
What fiber actually does
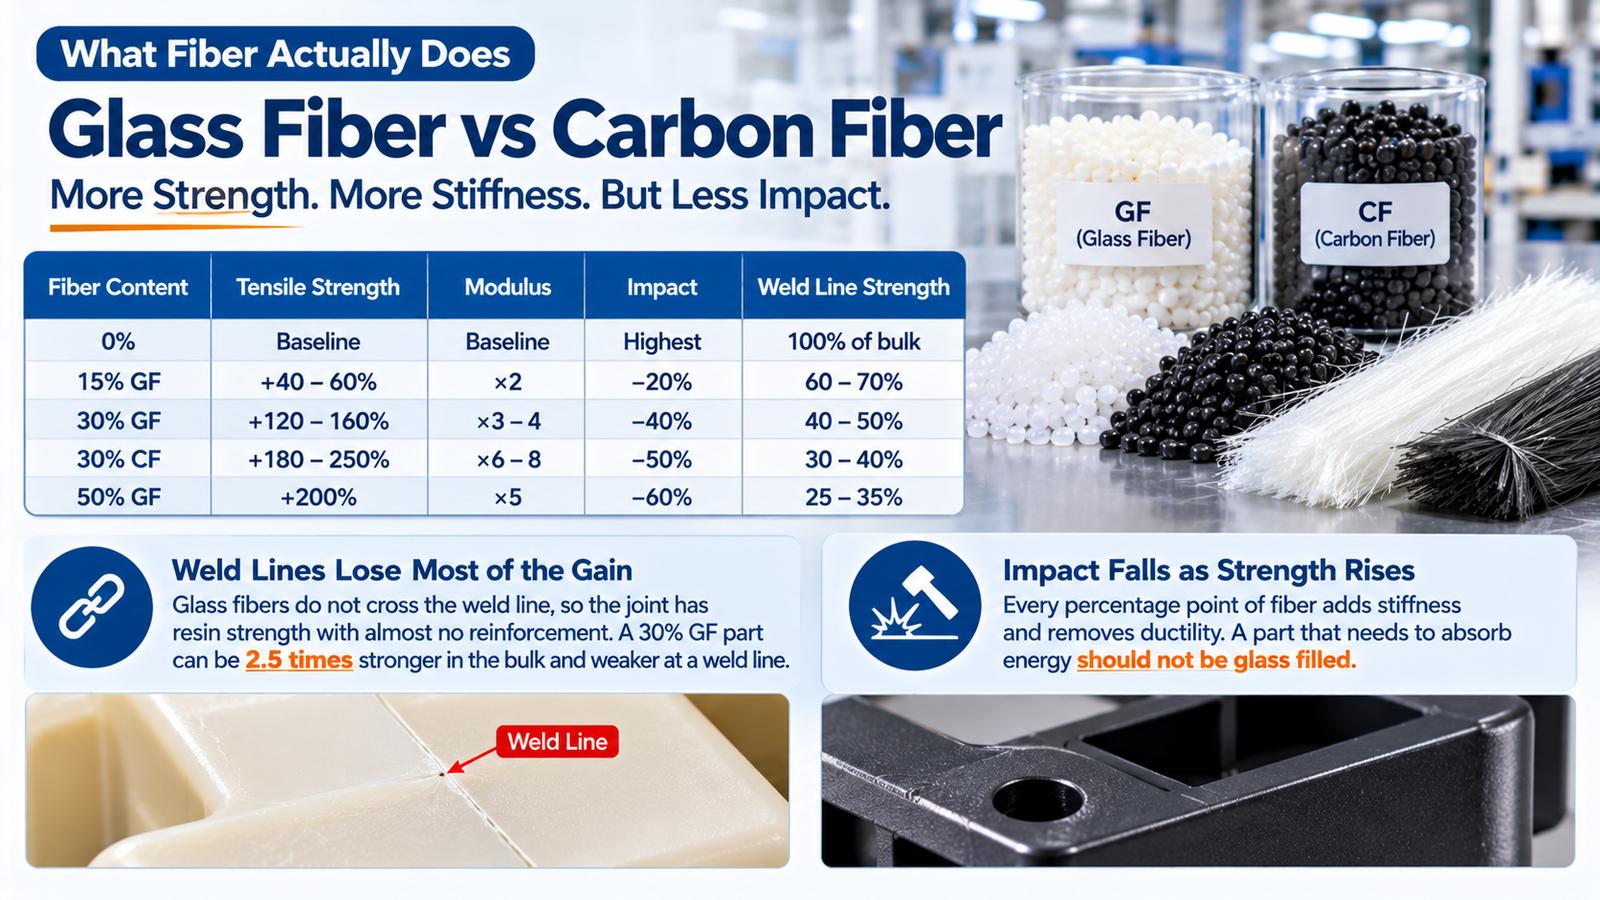
| Fiber content | Tensile strength | Modulus | Impact | Weld line strength |
|---|---|---|---|---|
| 0% | Baseline | Baseline | Highest | 100% of bulk |
| 15% GF | +40 – 60% | ×2 | −20% | 60 – 70% |
| 30% GF | +120 – 160% | ×3 – 4 | −40% | 40 – 50% |
| 30% CF | +180 – 250% | ×6 – 8 | −50% | 30 – 40% |
| 50% GF | +200% | ×5 | −60% | 25 – 35% |
Two consequences that catch designers out:
Weld lines lose most of the gain. Glass fibers do not cross the weld line; they align parallel to it, so the joint has resin strength with almost no reinforcement. A 30% glass-filled part can be 2.5 times stronger in the bulk and weaker than unfilled material at a weld line.
Impact falls as strength rises. Every percentage point of fiber adds stiffness and removes ductility. A part that needs to absorb energy should not be glass filled.
Specific strength: the ranking that matters for weight
| Material | Tensile (MPa) | Density | Specific strength (MPa/(g/cm³)) |
|---|---|---|---|
| PEEK-CF30 | 225 | 1.40 | 161 |
| PAI-GF30 | 175 | 1.50 | 117 |
| PPS-GF40 | 170 | 1.65 | 103 |
| PA66-GF30 | 170 | 1.36 | 125 |
| POM (unfilled) | 65 | 1.41 | 46 |
| PC | 65 | 1.20 | 54 |
| UHMW-PE | 25 | 0.94 | 27 |
PA66-GF30 outperforms PPS-GF40 on specific strength and costs a fraction as much — which is why it dominates structural brackets, housings and automotive under-hood parts where weight and cost both matter.
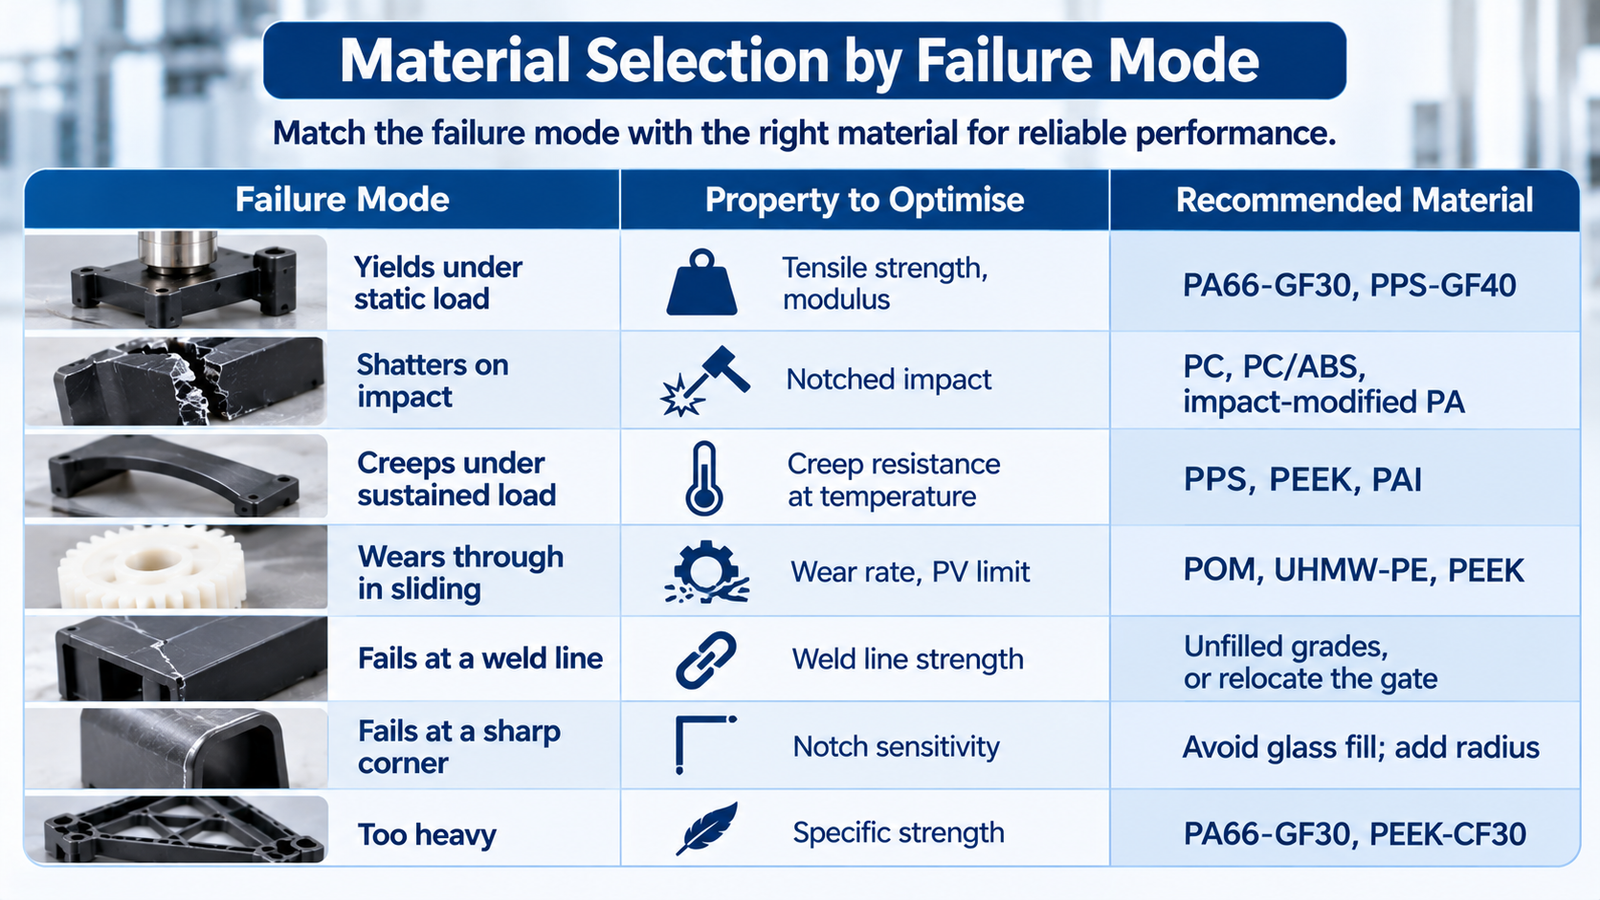
Material selection by failure mode
| Failure mode | Property to optimise | Recommended material |
|---|---|---|
| Yields under static load | Tensile strength, modulus | PA66-GF30, PPS-GF40 |
| Shatters on impact | Notched impact | PC, PC/ABS, impact-modified PA |
| Creeps under sustained load | Creep resistance at temperature | PPS, PEEK, PAI |
| Wears through in sliding | Wear rate, PV limit | POM, UHMW-PE, PEEK |
| Fails at a weld line | Weld line strength | Unfilled grades, or relocate the gate |
| Fails at a sharp corner | Notch sensitivity | Avoid glass fill; add radius |
| Too heavy | Specific strength | PA66-GF30, PEEK-CF30 |
The four mistakes that make "strong" parts fail
1. Specifying by data-sheet tensile strength. The data sheet value is measured on a standard test bar in a standard direction. A real part has corners, weld lines, flow orientation and thickness changes — and fails at whichever is weakest, not at the data-sheet average.
2. Ignoring weld lines. A glass-filled bracket with a weld line across its highest-stress section is weaker there than the same bracket in unfilled material. Move the gate or redesign the part; adding fiber does not help.
3. Confusing strength with stiffness. Strength resists breaking; stiffness resists deflecting. A part can be strong enough and still deflect far too much — in which case modulus, not strength, is the specification.
4. Adding fiber to fix a cracking problem. It raises strength and lowers toughness. If the part cracks, the answer is usually a radius, a thicker section, or an impact-modified grade — not more glass.
Process factors that decide real-world strength
| Factor | Effect on strength | Control |
|---|---|---|
| Melt temperature too low | Incomplete bonding, weak weld lines | Follow the grade's range |
| Mold temperature too low | High frozen-in stress, low crystallinity | 20 – 40 °C above minimum |
| Moisture in hygroscopic resin | Hydrolysis, 20 – 40% strength loss | Dry to spec |
| Excessive regrind | Fiber length reduction, lower strength | Limit to 15 – 20% |
| High injection speed on glass-filled | Fiber breakage, orientation | Moderate, profiled fill |
| Gate position | Sets weld line location and fiber orientation | Design review |
| Long residence time | Degradation | Size shot to machine |
Fiber length is the quiet one: every processing pass shortens the fibers, and strength depends on length. A part molded from 40% regrind can lose a third of its tensile strength without any visible defect.
Strongest plastic material: specification checklist
| Item | What to state |
|---|---|
| Failure mode being designed against | Tension, impact, creep or wear |
| Test standard and direction | ISO 527, and whether the value is flow or cross-flow |
| Weld line locations | Marked on the drawing, with the acceptable strength fraction |
| Fiber content and type | 30% GF, 30% CF, or unfilled |
| Conditioning | Dry-as-molded or conditioned — they differ by 20% for PA |
| Regrind allowance | Maximum percentage permitted |
| Safety factor | Explicit, not implied |
Related guidance
Our guides to hardest plastic material cover the hardness side, most durable plastic covers impact and wear, common injection molding materials covers the grade families, glass and carbon fiber in POM covers the reinforcement trade-off in detail, PA66 vs PBT vs PPS covers the automotive case, and weld line strength covers the joint that fails first. Structural design rules are in wall thickness and thick-part cracking.
Mechanical property data in this guide follows the test methods published by ASTM International (D638, D256, D790) and ISO (527, 179, 899), with typical values cross-checked against MatWeb and Engineering Toolbox. Processing practice reflects Plastics Technology guidance and PLASTICS industry standards, with material characterisation maintained through SPE and NIST reference data. For composite mechanics, see specific strength.
What is the strongest plastic material?
By tensile strength, carbon-filled PEEK at 200 to 250 MPa. By specific strength (strength per unit weight), PEEK-CF30 also leads, with PA66-GF30 the practical choice at a fraction of the cost. By impact resistance, PC wins by a wide margin.
Is glass-filled plastic stronger than unfilled?
In tension and stiffness, yes — 30% glass roughly doubles tensile strength and triples modulus. In impact, no — it drops 40%. And at a weld line it can be weaker than the unfilled grade, because fibers do not cross the weld.
Why does my glass-filled part break at the weld line?
Because fibers align parallel to the weld line instead of crossing it, so the joint has resin-only strength. Weld line strength in 30% glass-filled material is typically 40 to 50% of bulk strength, and 20 to 40% in some geometries.
What is the strongest plastic for its weight?
PEEK-CF30 at around 161 MPa per g/cm³. PA66-GF30 is close at 125 and costs roughly one-tenth as much, which is why it dominates weight-sensitive structural parts.
Does stronger mean less tough?
Almost always. Adding fiber raises tensile strength and stiffness while lowering impact resistance and elongation. If the part has to absorb energy, specify toughness (notched impact) rather than strength.
Can I improve strength by changing the process?
Yes, within limits. Correct drying, adequate melt and mold temperature, controlled regrind and gate position all affect achieved strength. A part molded from wet resin or excessive regrind can lose 20 to 40% of its strength with no visible defect.
Conclusion
The strongest plastic is carbon-filled PEEK by tensile strength, PC by impact, and PA66-GF30 by strength per dollar. Which one is "strongest" depends entirely on how the part fails — and the failure is rarely in the bulk material. It happens at a weld line, a sharp corner, a thickness change or a seam, none of which the data sheet describes.
At Rui Cheng we mold glass-filled PA, PPS, PEEK and POM on 80 to 1,400 tonne machines with bimetallic barrels, documented drying and gate positions reviewed at design stage, under ISO 9001 / IATF 16949. Send us the drawing plus the failure mode you are designing against, and we will come back with a material recommendation and an indicative part cost.